
THE most dangerous areas in Brighton and Hove have been revealed.
Brighton centre tops a list of the city’s regions that had the most reported crimes from January to August – the latest figures available from police.
More than 6,000 crimes were committed in the area, with antisocial behaviour (ASB), violent and sexual offences and thefts the most common.
Kemp Town is second, with 2,296 offences – again, ASB and violent and sexual crimes were carried out most regularly.
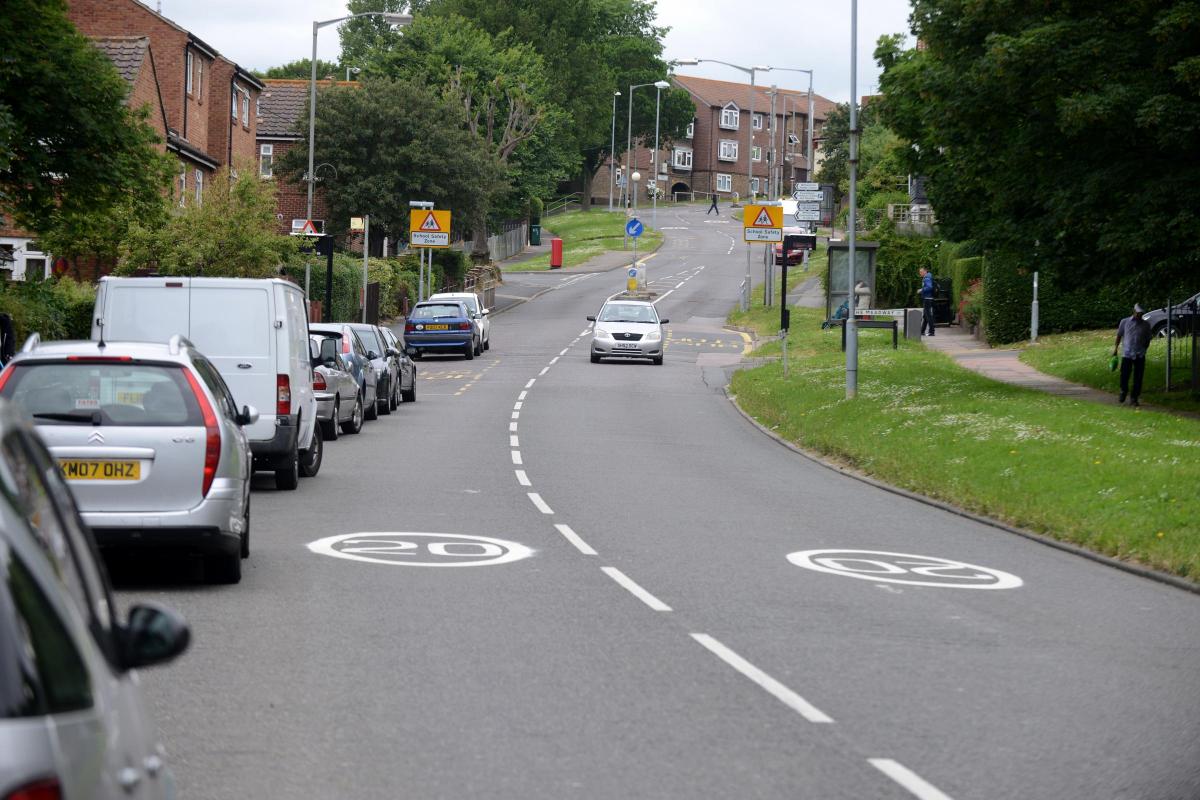
In terms of housing estates, Whitehawk leads the way with 1,306 crimes reported to Sussex Police in eight months.
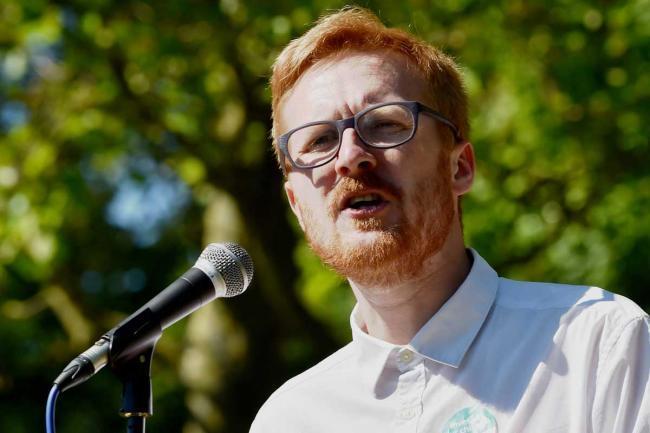
The area has a history of criminality and MP Lloyd Russell-Moyle, who represents Whitehawk and Kemp Town, believes nothing will change until the policing model does so.
His constituents are growing concerned about the crime level.
Mr Russell-Moyle said: “Residents are concerned that when they call the police, they do nothing. They turn out hours, if not days later.
“The reality is, if someone is committing a crime, 999 must be called.
“One of the big flaws has been community support officers. Traditionally it was the same officer in areas who knew the area and the people know them.
“(Nothing will change) unless something changes fundamentally in policing.”
The safest place to live, statistically, is Ovingdean, with just 40 crimes committed there.
Next is Rottingdean, with 69 reported offences.
Moulsecoomb which, like Whitehawk, has a history of being a crime hotbed, saw 438 offences happen. That puts it below Hollingbury, Hollingdean and Hangleton. The Brunswick and Adelaide area of Hove had 748 offences committed, making it one of the worst-affected areas.
The city centre areas have the highest number of crimes committed, with 1,062 happening in The Level/London Road area. The total number of crimes committed throughout the city is 20,829.
In response to the figures, Superintendent Ed De La Rue, of the force’s Brighton and Hove division, said: “We recognise different areas will always have different patterns of crime in terms of the number and type reported, for a host of reasons including population density, mix of commercial and residential premises, geographical location, and socio-economic factors – and these patterns change over time.
“We also need to bear in mind that there are some offences where we want to see increased reporting – not because we want to see more crime, but because we know that historically we haven’t seen the whole picture, in areas including hate
crime, domestic abuse and human trafficking and others – the so called ‘hidden crimes’.
“We continually review what we understand about levels of crime and disorder in the city, based on reported crime numbers but also on intelligence reports and analysis.”
A force spokeswoman added: “Local policing is at the heart of everything we do and the increase in council tax allows us to strengthen local policing.”
LEAGUE TABLE of BRIGHTON AND HOVE’S MOST DANGEROUS AREAS 2018
1 BRIGHTON CITY CENTRE: 6,002
2 KEMP TOWN: 2,296
3 CENTRAL HOVE: 1,687
4 WHITEHAWK: 1,306
5 LONDON ROAD, LEVEL AREA: 1,062
6 HANGLETON: 860
7 PORTSLADE: 791
8 BRUNSWICK AND ADELAIDE: 748
9 HOLLINGDEAN: 672
10 HOLLINGBURY: 634
11 MOULSECOOMB: 438
12 MILE OAK: 427
13 COOMBE ROAD/LEWES ROAD AREA: 425
14 PATCHAM: 382
15 WITHDEAN: 371
16 WOODINGDEAN: 319
17 SALTDEAN: 277
18 WISH AREA: 263
19 HANOVER: 236
20 ST ANNE’S WELL GARDENS/CRICKET GROUND: 235
21 PRESTON PARK: 223
22 ELM GROVE AREA: 215
23 HOVE PARK: 211
24 BEVENDEAN: 210
25 COLDEAN: 175
26 QUEEN’S PARK: 156
27 WESTDENE: 99
28 ROTTINGDEAN: 69
29 OVINGDEAN: 40


Comments: Our rules
We want our comments to be a lively and valuable part of our community - a place where readers can debate and engage with the most important local issues. The ability to comment on our stories is a privilege, not a right, however, and that privilege may be withdrawn if it is abused or misused.
Please report any comments that break our rules.
Read the rules hereLast Updated:
Report this comment Cancel