

THE coronavirus rates in all but one local authority area in Sussex have continued to fall, the latest figures show.
Mid Sussex was the only district to record a slight increase in the number of confirmed cases.
There were 124 cases recorded in the area in the week leading up to February 19, the latest complete figures, giving it a rate of 82.1 new cases per 100,000 population.
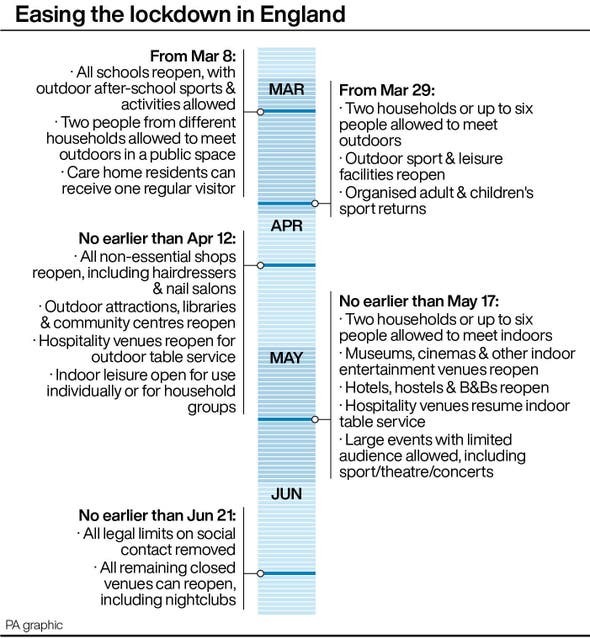
The government's plans for lifting coronavirus lockdown restrictions Credit: PA Graphics
During the previous week there were 114 cases in the district giving it a rate of 75.5.
This still remains well below the weekly coronavirus rate for all of England, which currently stands at 122.7 new cases per 100,000 population.
In Sussex, only Crawley (129.9) and Arun (132.5) have coronavirus rates above the national average, though both areas recorded significant decreases in the latest figures.
Here is the list of all the latest coronavirus rates in Sussex. From left to right, it reads: name of local authority; rate of new cases in the seven days to February 19; number (in brackets) of new cases recorded in the seven days to February 19; rate of new cases in the seven days to February 12; number (in brackets) of new cases recorded in the seven days to February 12.
- Arun, 132.5, (213), 152.4, (245)
- Crawley, 129.9, (146), 185.0, (208)
- Mid Sussex, 82.1, (124), 75.5, (114)
- Worthing, 76.0, (84), 93.2, (103)
- Chichester, 70.2, (85), 112.3, (136)
- Hastings, 61.5, (57), 119.8, (111)
- Adur, 54.4, (35), 73.1, (47)
- Brighton and Hove, 50.5, (147), 69.1, (201)
- Wealden, 49.5, (80), 68.1, (110)
- Eastbourne, 48.2, (50), 103.1, (107)
- Horsham, 39.6, (57), 83.5, (120)
- Rother, 34.3, (33), 43.7, (42)
Of the 315 local areas in England, 52 (17 per cent) have seen a rise in case rates, 260 (83 per cent) have seen a fall and three are unchanged.
Corby in Northamptonshire has the highest rate in England, with 249 new cases recorded in the seven days to February 19 – the equivalent of 344.8 cases per 100,000 people.
This is up from 315.7 cases per 100,000 people in the seven days to February 12.
- READ MORE: The three areas of Brighton and Hove where coronavirus rates have been expressed
Peterborough has the second highest rate, up slightly from 264.0 to 270.9, with 548 new cases.
Middlesbrough is in third place, down from 322.0 to 267.4, with 377 new cases.
Of the 52 areas to record a week-on-week rise, the top five are:
- Rutland (up from 135.2 to 240.4)
- North Warwickshire (176.2 to 234.4)
- Gosport (107.3 to 145.0)
- Craven (42.0 to 77.0)
- Corby (315.7 to 344.8)
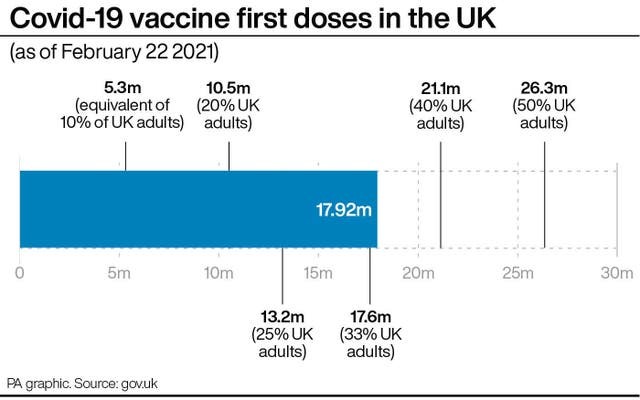
Progress on the coronavirus vaccine rollout Credit: PA Graphics
The figures, for the seven days to February 19, are based on tests carried out in laboratories (pillar one of the Government’s testing programme) and in the wider community (pillar two).
The rate is expressed as the number of new cases per 100,000 people.
Data for the most recent four days (February 20-23) has been excluded as it is incomplete and does not reflect the true number of cases.


Comments: Our rules
We want our comments to be a lively and valuable part of our community - a place where readers can debate and engage with the most important local issues. The ability to comment on our stories is a privilege, not a right, however, and that privilege may be withdrawn if it is abused or misused.
Please report any comments that break our rules.
Read the rules hereLast Updated:
Report this comment Cancel