

The latest coronavirus figures make for optimistic reading for people in Brighton and Hove.
The city has gone from recording more than 2,200 new cases in the week leading up to January 8 to just 94 new cases in the latest complete figures, taken from the seven days leading up to March 5.
This means the Brighton and Hove weekly coronavirus rate has plummeted from 771 new cases per 100,000 residents to 32.3 in less than two months.
Brighton city centre under the third national lockdown restrictions
Within the city, Public Health England has released further data which details where these remaining coronavirus cases have been identified.
Brighton and Hove is broken down into Middle Super Output Areas (MSOA) - a geographic hierarchy system designed to improve the reporting of small area statistics, with each area having a minimum population of 5,000 and a maximum population of 7,200, and are updated daily.
In areas where less than three new weekly coronavirus cases have been reported, data has been "suppressed" to "protect individuals' identities".
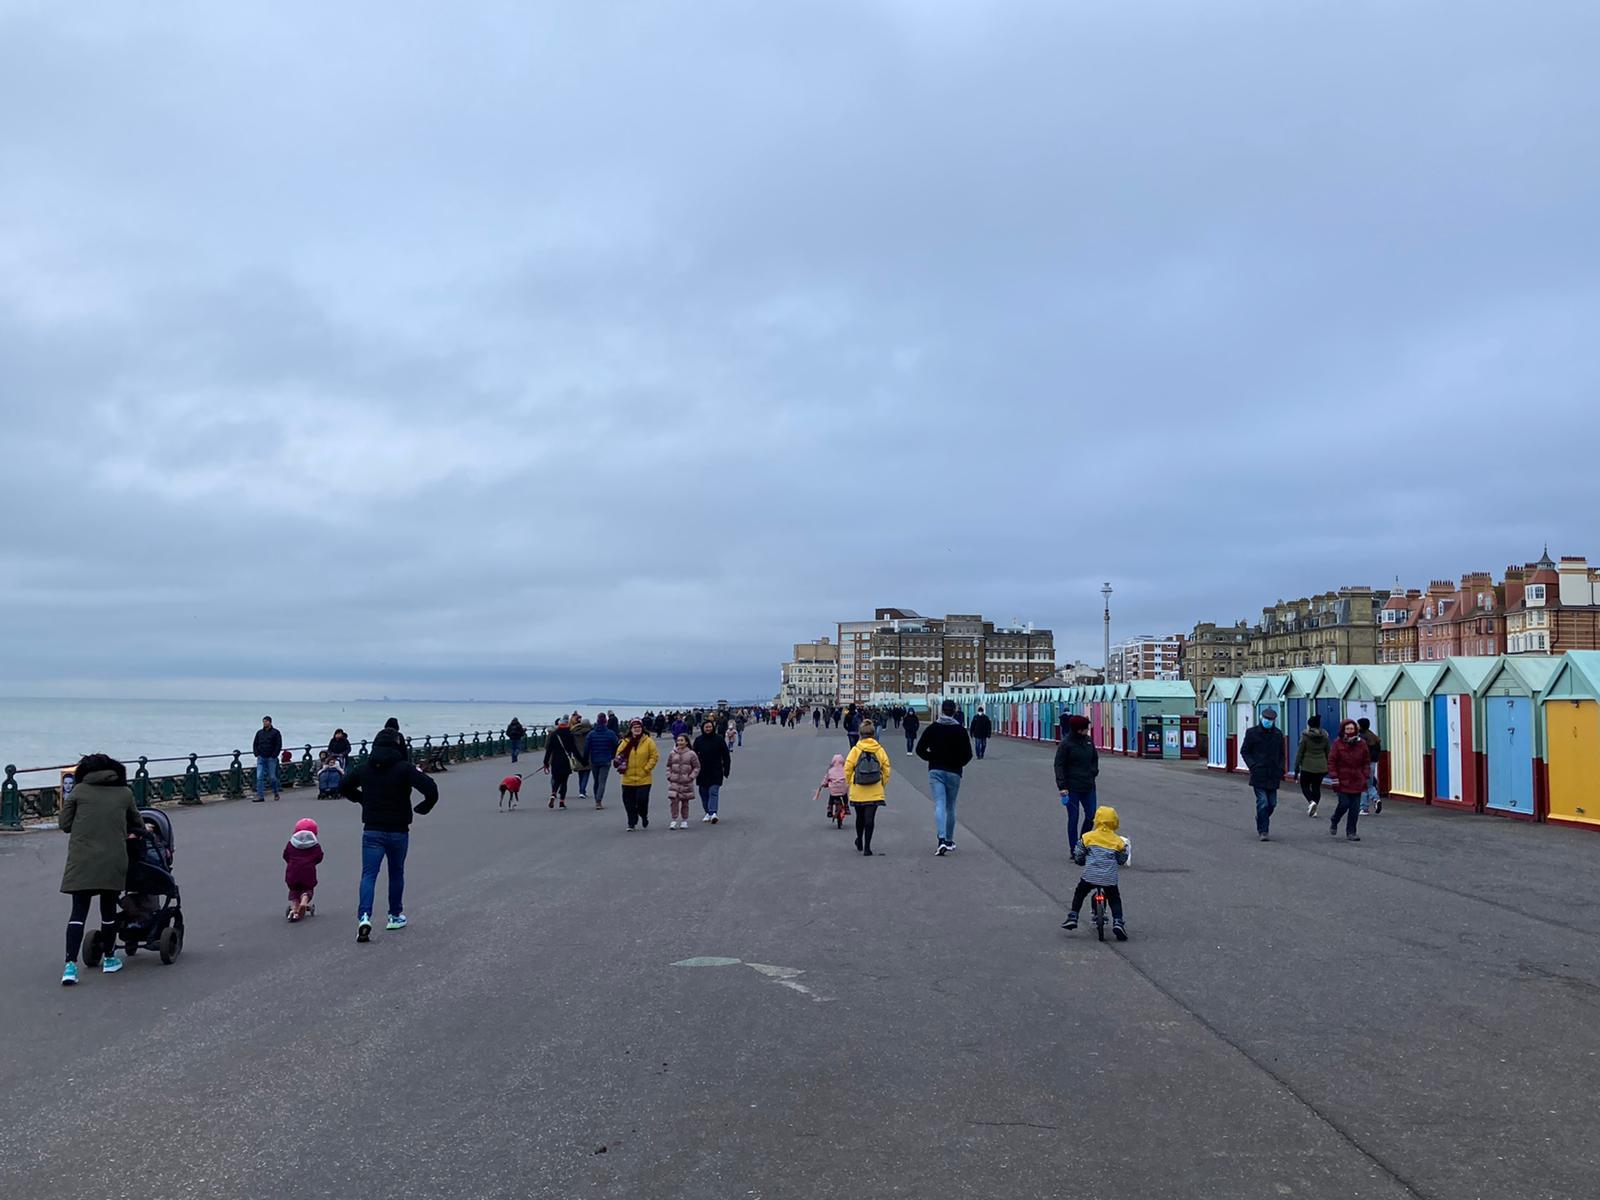
Brighton seafront under the third national lockdown restrictions
These are the parts of Brighton and Hove which recorded less than three new coronavirus cases in the latest figures, covering the week up to March 5:
- Bevendean and Moulsecoomb East
- Hollingdean and Moulsecoomb West
- Preston Park
- Withdean Woods
- Goldsmid East
- Goldsmid West
- King Alfred
- Aldrington
- Aldrington South
- Hangleton South
- Hangleton North
- Portslade Village
- Mile Oak
- Rottingdean and Saltdean
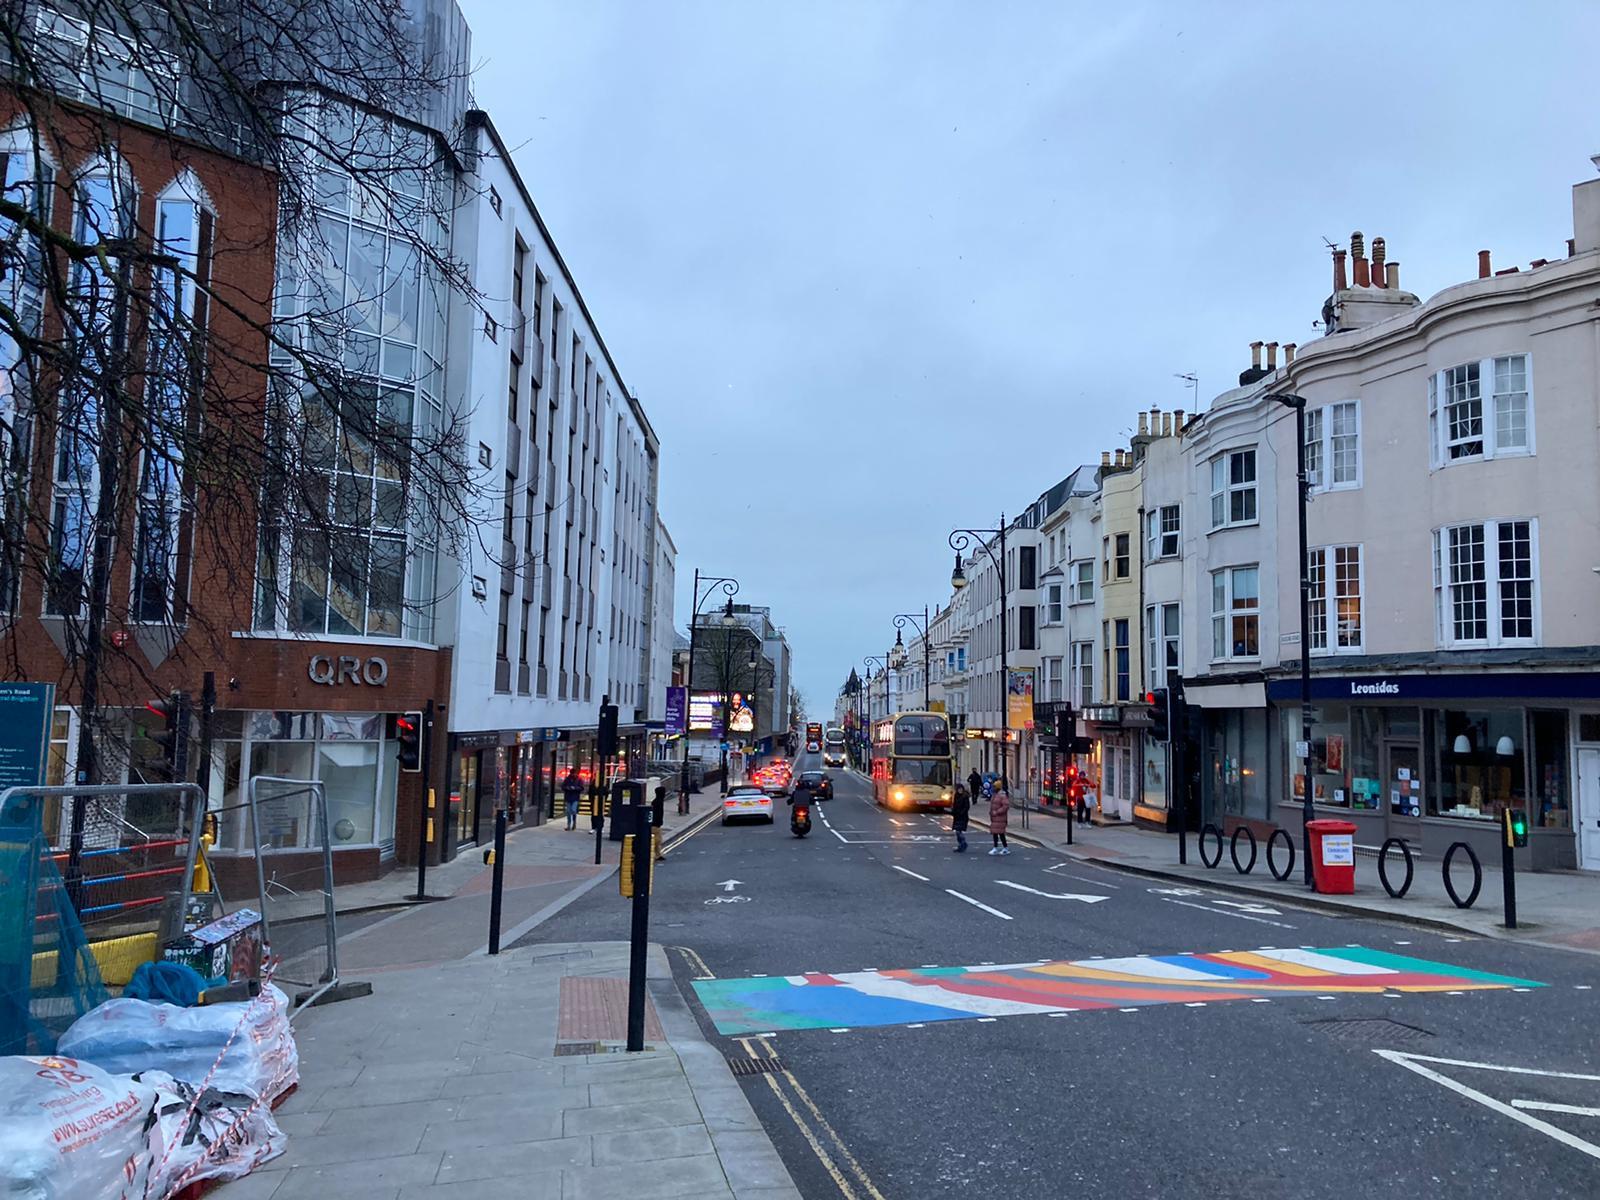
Brighton city centre under the third national lockdown restrictions
These are the latest coronavirus figures for all other areas of Brighton and Hove in descending order. Data is written as; place name: number of new Covid-19 cases per 100,000 population in the week leading up to March 5, number of new cases in the week leading up to March 5:
- Patcham and Westdene: 109.4, 9
- North Laine and the Lanes: 94.7, 12
- St James's Street and Queen's Park: 84.9, 8
- Portslade-by-Sea: 58.8, 5
- Coldean and Moulsecoomb North, 51.2, 6
- Woodingdean: 50.8, 5
- Fiveways: 48.6, 4
- Hove Central: 44, 4
- Seven Dials: 41.8, 4
- Brunswick: 40.5, 4
- West Blatchington: 39.2, 3
- Roedean and Marina: 38.9, 3
- Round Hill: 38.6, 4
- Patcham East, 38.2, 3
- Whitehawk: 32.7, 3
- Elm Grove and Bear Road: 30.5, 3
- Hanover: 30.2, 3
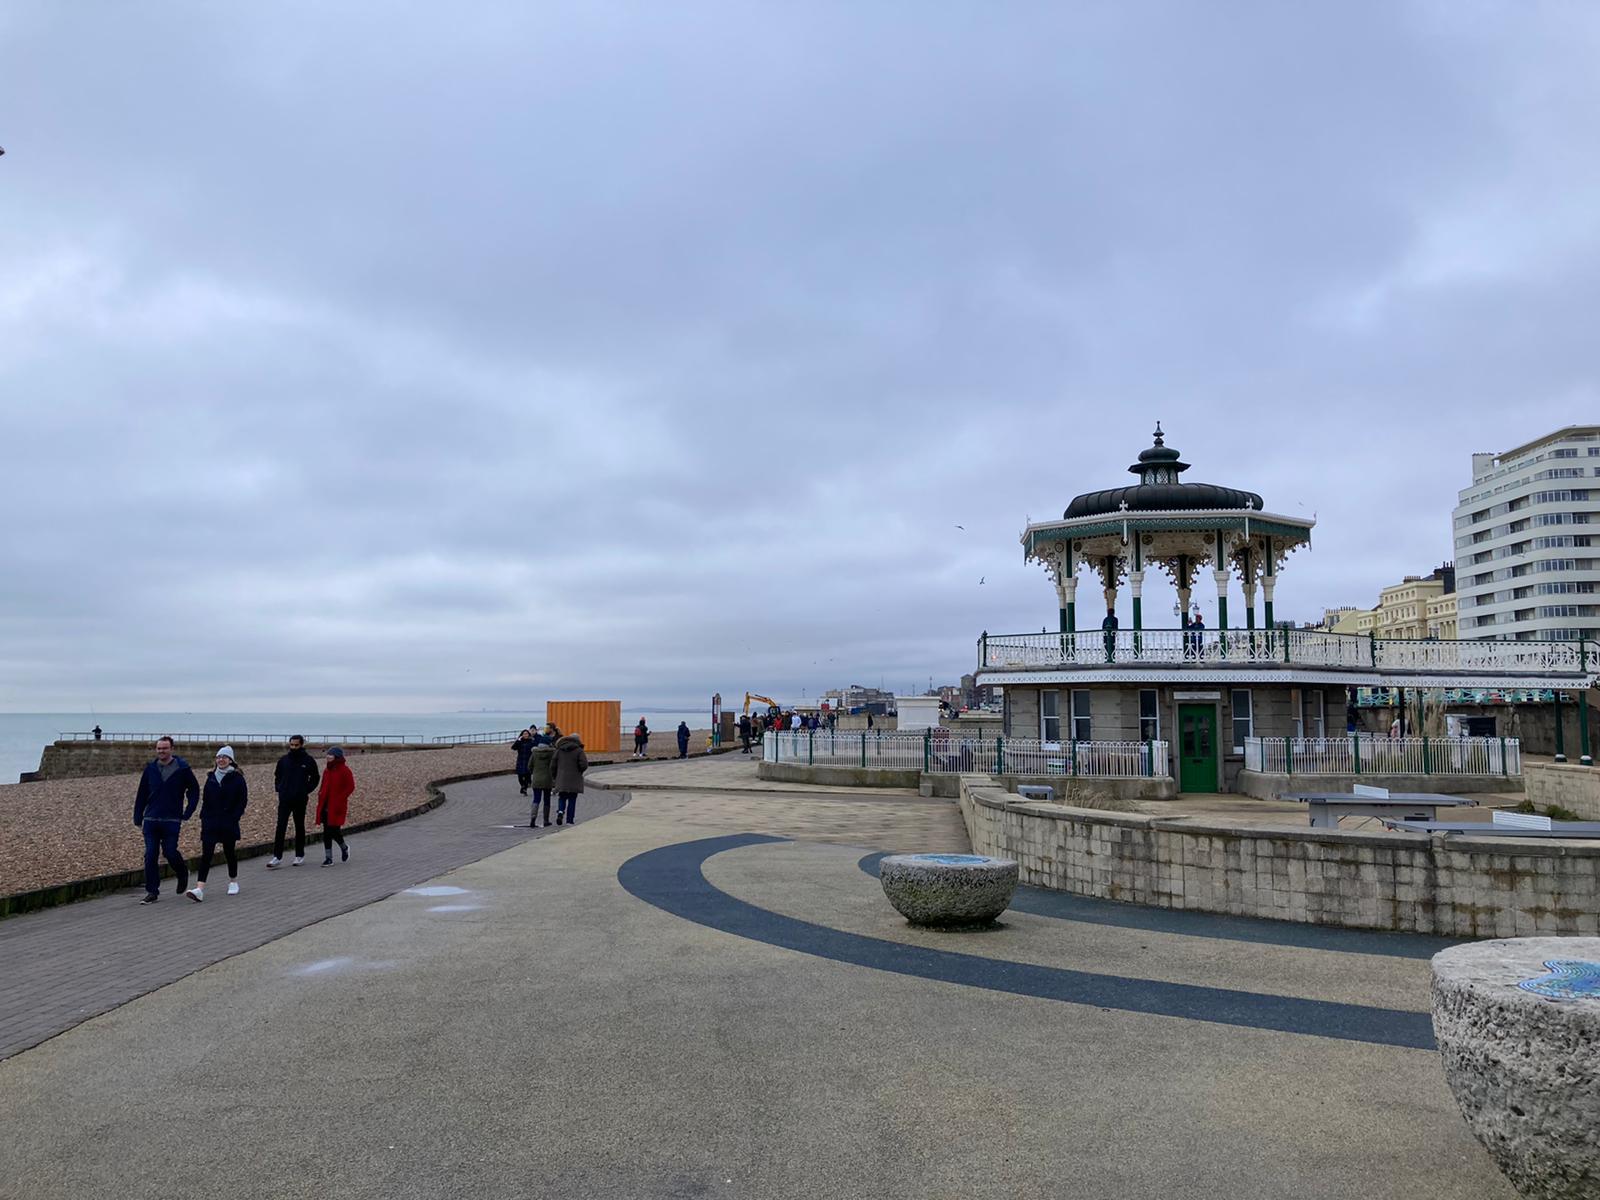
Brighton seafront under the third national lockdown restrictions
The latest average weekly coronavirus rate in England is 62.8, while the figure for the South East currently stands at 39.1.
The figures, for the seven days to March 5, are based on tests carried out in laboratories (pillar one of the government’s testing programme) and in the wider community (pillar two).
The rate is expressed as the number of new cases per 100,000 people.
Data for the most recent four days (March 6-9) has been excluded as it is incomplete and does not reflect the true number of cases.


Comments: Our rules
We want our comments to be a lively and valuable part of our community - a place where readers can debate and engage with the most important local issues. The ability to comment on our stories is a privilege, not a right, however, and that privilege may be withdrawn if it is abused or misused.
Please report any comments that break our rules.
Read the rules hereLast Updated:
Report this comment Cancel